Hello all,
This is the last part of the JNLP Application Security Assessment, Part 4 Dynamic Analysis. In this part we will attack the authentication and authorisation flaw depicted in the previous post.
[sourcecode lang="java"]
ActionListener listener = new ActionListener() {
public void actionPerformed(ActionEvent actionEvent) {
String un = usernameTxt.getText();
String pw = passwordTxt.getText();
if (authenticate(un , pw ))
{
buildGUI( un );
}
};
};
[/sourcecode]
Using a java debugger and a java bytecode editor the following two attacks will be performed:


Authorisation Bypass (Debugging).
For this scenario we will execute the sample application with the debug directive and later attach a debugger to it in order to manipulate its runtime. For this the JSwat tool from http://sourceforge.net/projects/jswat/ will be used.
First lets manipulate the sample application start command to start with the debug directive, open a socket to which our debugger will attach and start in the suspended state (-agentlib directive).
Depending on the java version, different directives may be required or there may be multiple ways to set this up. The aforementioned works for java 1.6/1.5.
So once this is executed the jvm sits in suspended mode and waits for out debugger to be attached.
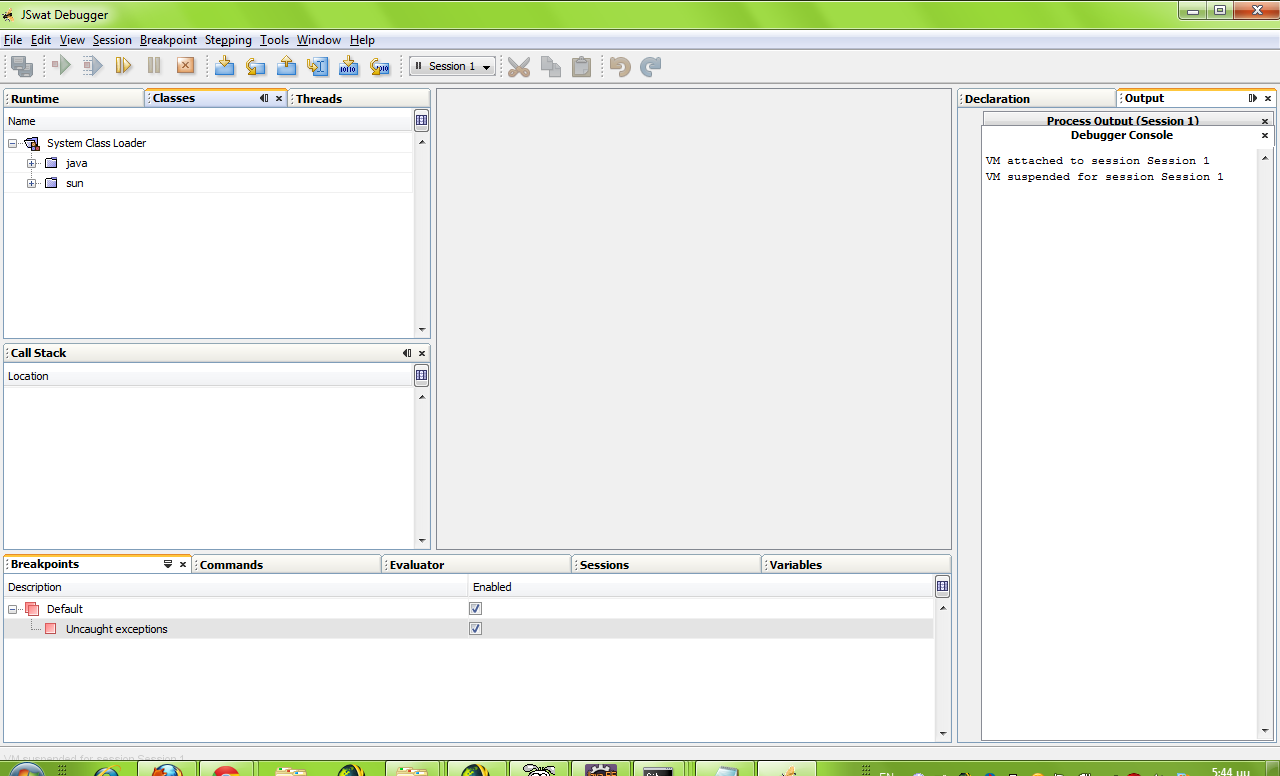
So we start jswat and attach to the suspended process in the network port that was declared above (8000). Once it has attached there is the option to attach the sources as well via the session properties. Doing so will make our life a lot easier since it will provide us with realtime access to variables and the call stack.
Furthermore you need to go to the Window -> Debugging menu option and enable the Evaluator and Command tabs.
So after starting the sample application:
The aforementioned is meant only as a guide to what you can do with a java debugger and how you can manipulate an application at runtime. The more you familiarise yourself with the debugger and its functions the more fun you can have with it and the tested application.
This concludes the 4th and last post on attacking jnlp applications.
I hope it proves a valuable resource to someone as it will be to me at some future point.
This is the last part of the JNLP Application Security Assessment, Part 4 Dynamic Analysis. In this part we will attack the authentication and authorisation flaw depicted in the previous post.
[sourcecode lang="java"]
ActionListener listener = new ActionListener() {
public void actionPerformed(ActionEvent actionEvent) {
String un = usernameTxt.getText();
String pw = passwordTxt.getText();
if (authenticate(un , pw ))
{
buildGUI( un );
}
};
};
[/sourcecode]
Using a java debugger and a java bytecode editor the following two attacks will be performed:
- Edit the .class file in order to disregard any authentication outcome and build a gui provided a valid username is returned.
- Use a debugger to alter the value of the un variable between the two calls in order to authenticate with one user but gain the privileges of another (normal user to admin elevation).
Authentication bypass (ByteCode Injection)
For this scenario JavaByteCode Editor from http://www.cs.ioc.ee/~ando/jbe/ will be used.
- First, open the JNLPFrame.class in JBE and navigate to the authenticate function.
- You can see that it is returning the integer outcome of the com/jnlptest/Auth2Service/authenticate method. This will either be 0 (false) or 1 (true) depending on whether the username and password provided are correct or not. ireturn will return the top item in the stack.
- We can manipulate this by adding a constant 1 to the top of the stack prior to the ireturn statement as follows and hit the "Save Method" button

- Executing now the sample application loads the interface associated with our user regardless of the typed password.

Authorisation Bypass (Debugging).
For this scenario we will execute the sample application with the debug directive and later attach a debugger to it in order to manipulate its runtime. For this the JSwat tool from http://sourceforge.net/projects/jswat/ will be used.
First lets manipulate the sample application start command to start with the debug directive, open a socket to which our debugger will attach and start in the suspended state (-agentlib directive).
C:\analysis2\bin>java -Xnoclassgc -Djnlp.versionEnabled=true -esa -agentlib:jdwp=transport=dt_socket,server=y,address=8000 com.jnlptest.TestJnlp
Depending on the java version, different directives may be required or there may be multiple ways to set this up. The aforementioned works for java 1.6/1.5.
So once this is executed the jvm sits in suspended mode and waits for out debugger to be attached.
So we start jswat and attach to the suspended process in the network port that was declared above (8000). Once it has attached there is the option to attach the sources as well via the session properties. Doing so will make our life a lot easier since it will provide us with realtime access to variables and the call stack.
If attaching the sources is not an option for whatever reason (eg. maybe the decompilation process did not complete correctly from some or all of the classes), not everything is lost. You can still attach to the process see class names and set breakpoints, but before seeing variables and the call stack you must go to the Threads tab and set the current thread as "Current". You may occasionally have to close the Variables tab and reopen it since it does not refresh properly at each set breakpoint.
Furthermore you need to go to the Window -> Debugging menu option and enable the Evaluator and Command tabs.
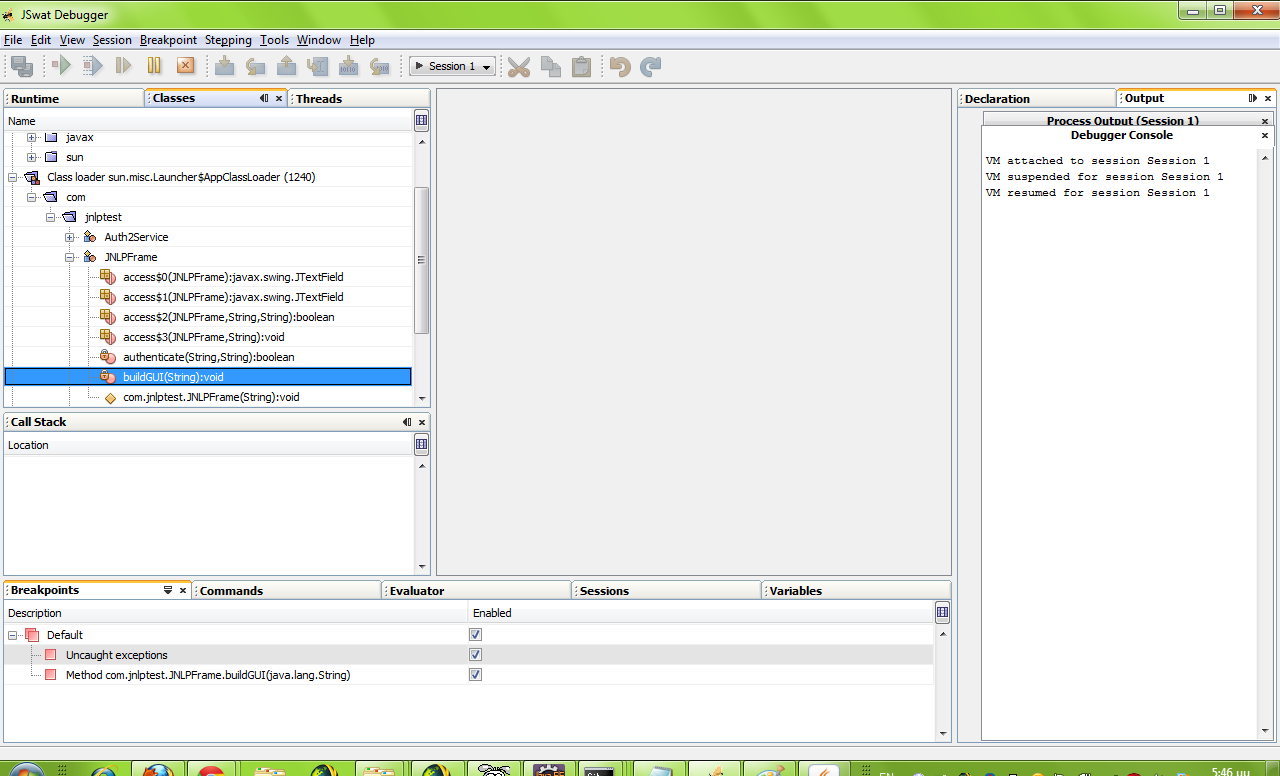
So after starting the sample application:
- Start jswat and attach to the process.
- Hit the continue button (At this point the application login screen will appear)
- Find the buildgui method and set the breakpoint
- Use the session -> settings -> source menu options to point to the folder where the source files are
- Fill in the normal user credentials and press the Login button.
- The breakpoint is hit (assuming you entered the correct credentials).
- The Variables window shows the variables in play.
- Use the Evaluator window to alter the u parameter to "admin"
- Hit continue and the administrator related functions will be made available.
The aforementioned is meant only as a guide to what you can do with a java debugger and how you can manipulate an application at runtime. The more you familiarise yourself with the debugger and its functions the more fun you can have with it and the tested application.
This concludes the 4th and last post on attacking jnlp applications.
I hope it proves a valuable resource to someone as it will be to me at some future point.
./Z


No comments:
Post a Comment
Note: only a member of this blog may post a comment.